Hot Spots of Patent Activity – Website Visually Maps Issued US Patents
Feb 24th, 2015 by Cambria Alpha-Cobb | News | Recent News & Articles |
The Map Room, a branch of the innovative site Way Better Patents™, recently presented an interesting “down to earth” look at innovation: heat maps of the topology of invention across the geography of the United States. See http://www.comingsoon.waybetterpatents.com/maproom/20150217_map_room.html
Invention activity is presented at the national, state level, and county level, providing a view of the number of patents issued in 2015. Data is also provided on a weekly basis. Additionally, the data is also broken out by individual inventors versus companies, universities, and entities for the time periods.
Immediately noticeable on the national maps are the hot spots of deep blue, where the highest number of patents was received. The Seattle area, San Francisco, and San Diego in the West, and Connecticut, Massachusetts, and New York in the North East immediately jump out. On the other hand, many states are almost completely gray, signaling no patent activity.
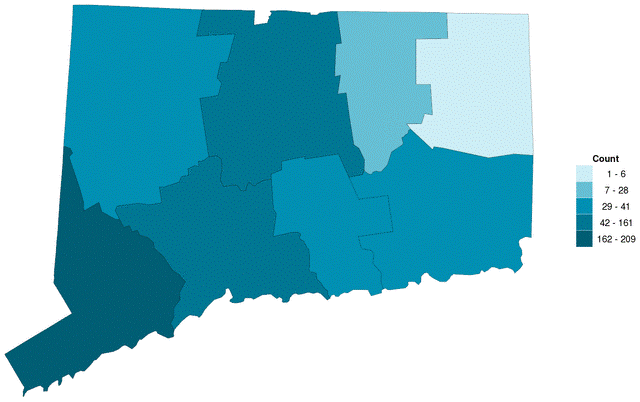
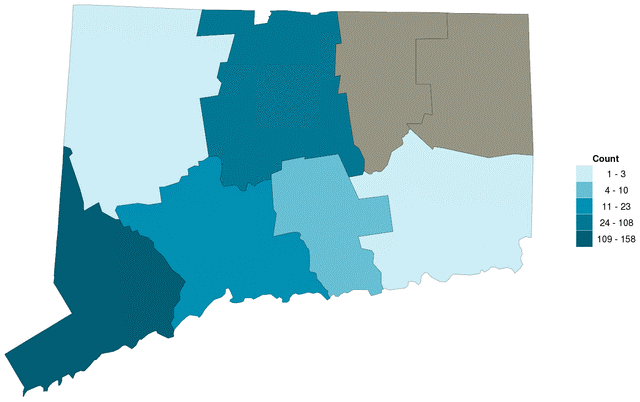
Heat maps are also provided for individual states, showing activity by county. The following are the Connecticut maps taken from the website showing the relative number of patents granted to date for 2015. The Connecticut maps are also available for the most recent week.
Connecticut inventors (top map) and Connecticut companies, universities and entities (bottom map) that received patents in 2015 (through the week of February 17th). A solid gray map indicates none in the category.
Even though this is a great site with interesting data, the number of patents received is not the only measure of innovation. What other quantifications could be used to monitor the full span of innovation? Research articles? Patent applications filed? Start-up companies launched?
Also, further breakouts could probably be made from the current data. What if one was to break down the maps into more specific technology categories? Or perhaps patents issued per region per capita? For example, do urban settings foster a more patent initiating environment?
Nevertheless, these beautiful presentations help us to visually understand the dynamics and distribution of invention, or as stated on the site “to find new emerging markets for the latest technology.” Over time, analyses like this will turn the evolution of innovation into a functional piece of art that could open the doors to new opportunities and business ventures.
– Cambria J. Alpha-Cobb, PhD and Anthony D. Sabatelli, PhD, JD
This article is for informational purposes, is not intended to constitute legal advice, and may be considered advertising under applicable state laws. The opinions expressed in this article are those of the author only and are not necessarily shared by Dilworth IP, its other attorneys, agents, or staff, or its clients.


